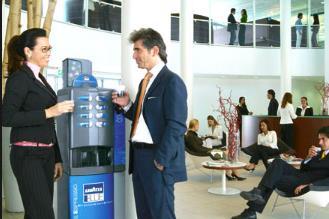
Our office recently installed a new coffee-maker machine that brews everything from café lattes to mochaccinos, in various flavours, sizes and potencies – the only thing that’s missing is a friendly barista to hand it over to you with a bite-sized biscotti.
Distraction or productivity booster?
This is a tough question to answer. A recent study by Staples Advantage indicates that taking frequent breaks rejuvenates creative juices and increases productivity levels. Yet a study from CareerBuilder reveals repeated snack/smoke breaks as #8 on its top 10 list of workplace distractions.
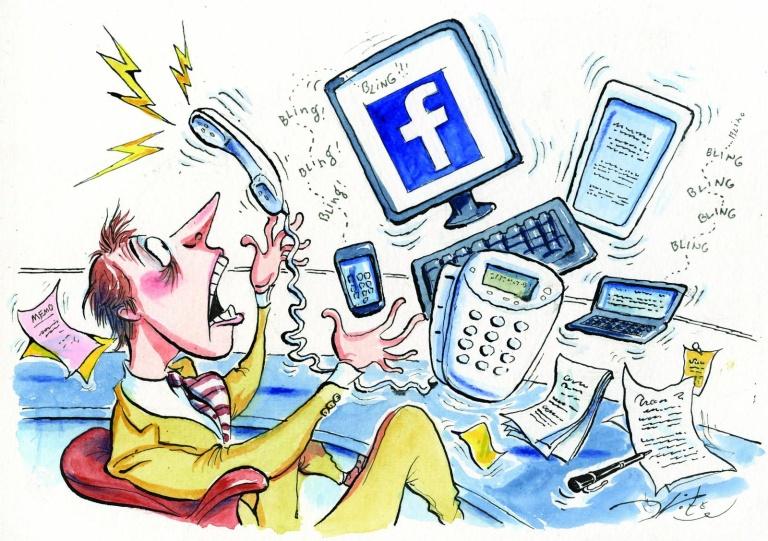
The top 5 on the list will come as no surprise to anybody – cellphones/texting, the Internet, gossip, social media and email. No doubt productivity is suffering in today’s work place.
For executives and senior management, this makes it difficult to gauge productivity in office environments. Everyone looks busy – but how do you know if it’s work-related or personal, social media that’s eating up valuable company resources, where productivity is not tangible on a daily, weekly or quarterly basis? This leads to another question – how do we capture real-time metrics or their Key Performance Indicators (KPI) and display these numbers in a way that’s most engaging for executives and more importantly the people on front line?
“When I worked in the family pasta business, I used a spreadsheet to document performance levels in our 3 locations across the city,” recalls John Liberatore, Owner/Founder of MyMedia Inc. “This limited my ability to see what was happening in real-time. And when I was travelling, it proved to be a real pain to access.”
“When I worked in the family pasta business, I used a spreadsheet to document performance levels in our 3 locations across the city,” recalls John Liberatore, Owner/Founder of MyMedia Inc. “This limited my ability to see what was happening in real-time. And when I was travelling, it proved to be a real pain to access.”
Today, spreadsheets are still being used to measure project deliverables and capture data. Although they’re convenient to use, they rate poorly in the capacity to provide real-time insights that can spur progressive changes – when you need them, as you need it.
“So when my clients approach us with their operational challenge, I understand their pain, because I have experienced it firsthand.” John explains. “I’m also really passionate about solving business problems with display technology. In my past career, getting a report at the end of the month was frustrating because I couldn’t do anything about poor performance numbers.”
Immediate access to your company’s productivity levels is invaluable, especially when you’re focused on increasing efficiencies and raising profit margins.
The solution?
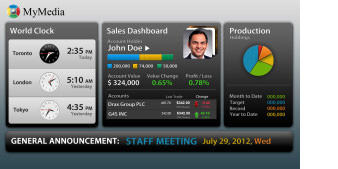
Corporate Digital Dashboards.
Today, organizations can take their data from their systems in real-time and access it anywhere with an Internet connection. You can also take multiple different applications and show it on one display, adding algorithms between these data points that can generate notifications about your operation. This is what the industry calls Business Intelligence (BI). For example, when a project falls behind schedule, the Dashboard will detect and display a personalized notification on the screen to notify the team of a potential problem. Since this is happening in real-time, the team can quickly get things back on track.
In John’s case, running a business and monitoring productivity with a spreadsheet was also limiting. “I always dreamed about having something that could give me the visibility of productivity from multiple locations at a glance. But the technology just wasn’t easily accessible 12 years ago.”
Not the case today. A digital corporate dashboard becomes your corporate, visual storyboard. Through the use of dynamic graphics and video streaming, it becomes an integral tool that is as engaging as it is informative.
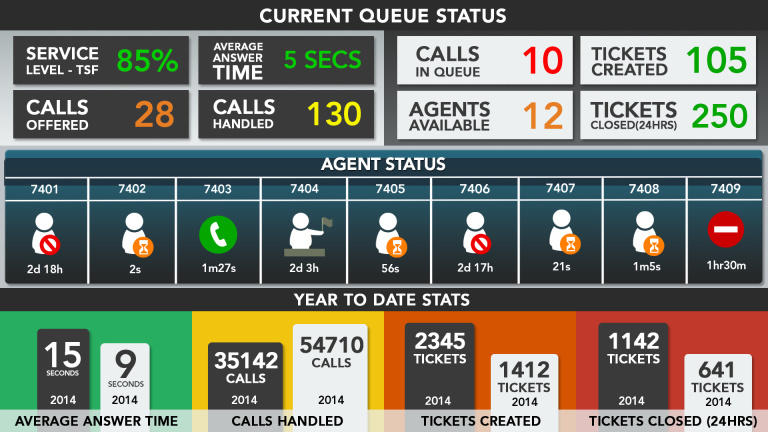
This was clearly demonstrated when the Town of Oakville approached MyMedia for a solution that could display real-time visibility for their call center, staff and executive team.They integrated the Mitel telephone system and data from a Customer Relationship Management (CRM). This enabled the call center supervisors and agents the real-time visibility they needed to keep track of their KPI’s. Also, it provided the call center team real-time actionable insights that enabled them to operate more effectively.
Another added feature of a digital dashboard is the ability to incorporate historical data as an incentive to raise productivity levels. Once you can see how many widgets were ordered and produced at the same time last year, with the same number of employees, what better way to motivate your workers by making these numbers visible in a place for everyone to see?
At the end of the day, you want to impact the bottom line without jeopardizing your working relationships with your employees.
John knows firsthand what that’s all about. “Listen, you can have all the latest technology in the world, but if you don’t know how to use it properly, in a way that makes people feel valued and excited to be at work, then stick to those spreadsheets. Data Visualization isn’t just about throwing a PowerPoint to the screen. It’s about having the pulse of your company’s heartbeat right at your fingertips.”
Whether you’re in charge of an office, warehouse or call center, a digital dashboard makes what’s invisible, visible to the entire organization, as it seamlessly starts to whittle away at the most common workplace distractions.
That’s good news for both your bottom line and corporate initiatives.
Time for a break. Cappuccino, anyone?